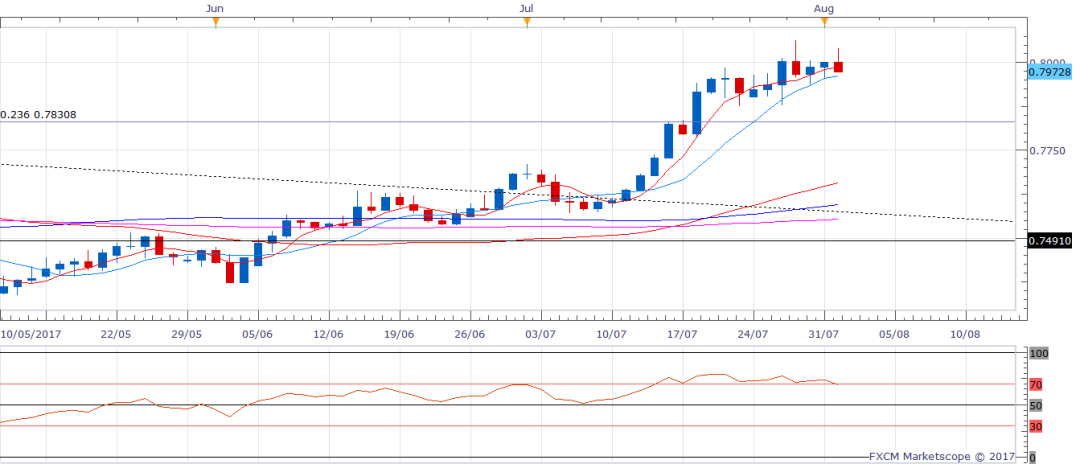
Bearish price RSI divergence on the daily chart
Sell around 0.7990
Objective 0.7892-0.7860
Stops above 0.8043
Bearish price RSI divergence on the daily chart
Sell around 0.7990
Objective 0.7892-0.7860
Stops above 0.8043
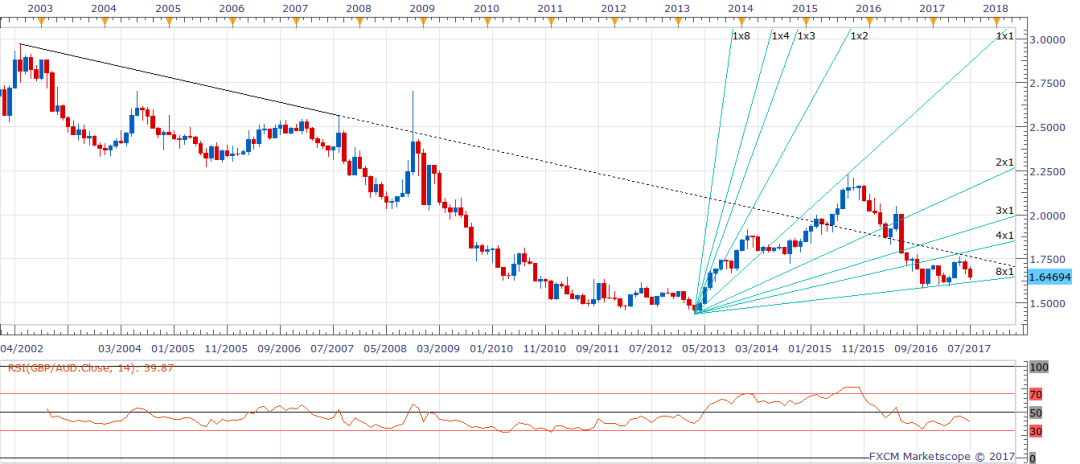
Monthly chart – Watch for a break below or rebound from 1.6190… upside to be capped around 1.75, below 1.6190 would expose 1.5789 Oct 2016 low
Hourly chart

A nice falling trend line has been established following the ECB’s dovish rant. The spot looks set to test 1-hr 200-MA – 1.1461. That would push the RSI into the oversold territory, so further losses are to be viewed with caution…
Daily chart – rising trend line coming from Apr 17 low and May 11 low offered supp around 1.1497 has been breached. ECB still stands ready to boost asset purchases if required… now this is likely to disappoint the EUR bulls..
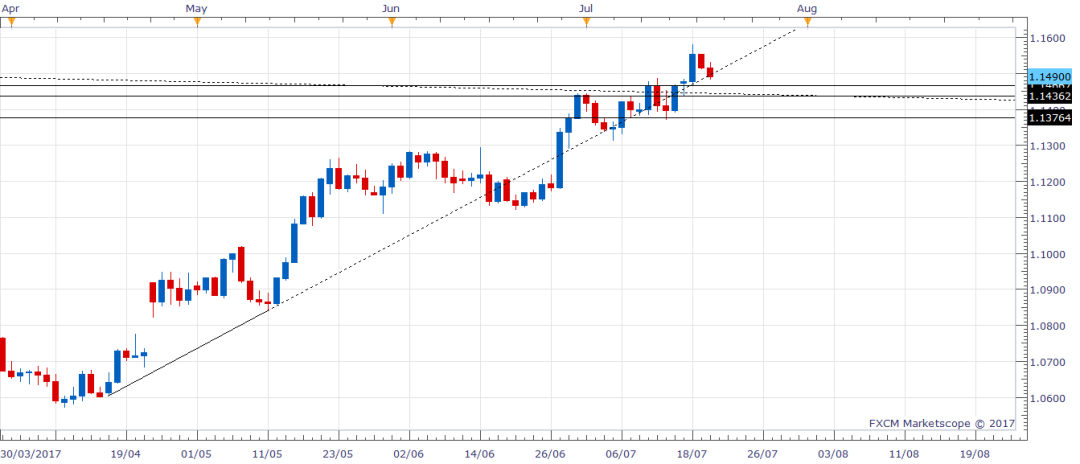
The horizontal lines represent key support levels: 1.1467, 1.1436, 1.1376
The descending trend line is also seen offering support around 1.1450
Weekly chart

Cable is hanging around 10-DMA level of 1.2961 after the post-retail sales rally fell apart at 1.3020.
The 1-hour 200-DMA level of 1.2965 has been breached. The quid has retraced 50% of the rally from 1.2812. 61.8% is 1.2932 – that is where the current sell-off may come to a halt, although I prefer to be a seller on upticks…
Monthly chart – Spot currently trades at 1.2590
1.2461 – May 2016 low
1.2239 – confluence of rising trend line and upward sloping monthly 50-MA
1.2621 – 50% Fibonacci retracement of 1.6185-0.9057
1.2672 – 38.2% Fibonacci retracement of 0.9407-1.4690
Indicators – RSI has turned bearish, MACD shows the bearish momentum is gathering pace
Monthly chart

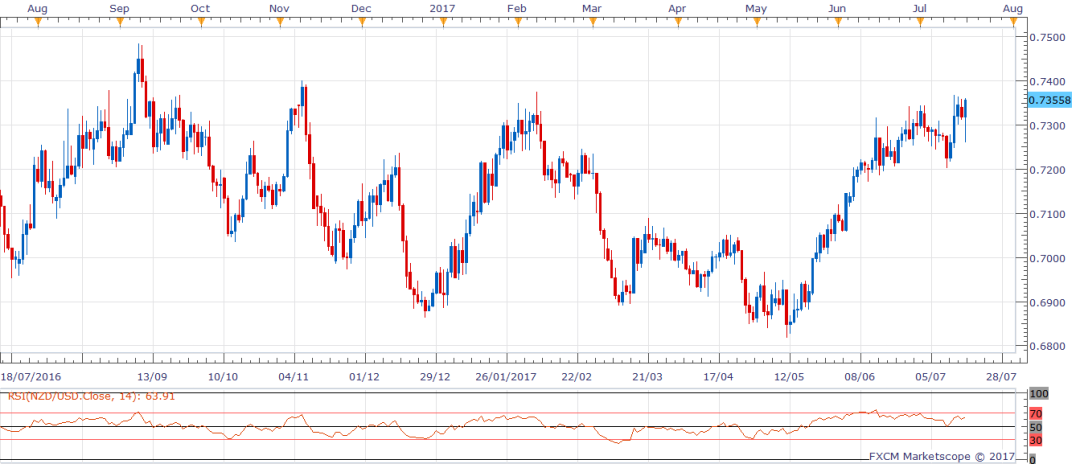
Today’s candle is super bullish…watch the sharp recovery from the session low of 0.7260. The RSI has nicely bounced off 50 levels. An end of the day close above 0.7368 would bring in fresh bids for 0.7485 (Sep 2016 high) – 0.7500 levels.
Daily chart
Weekly chart – The trend line resistance rests somewhere around 0.8860. The cross currently trades around 0.8873 levels. Since late May, numerous attempts to break higher convincingly have failed… especially the last week’s candle, which turned really ugly following a failure to hold above trend trend line
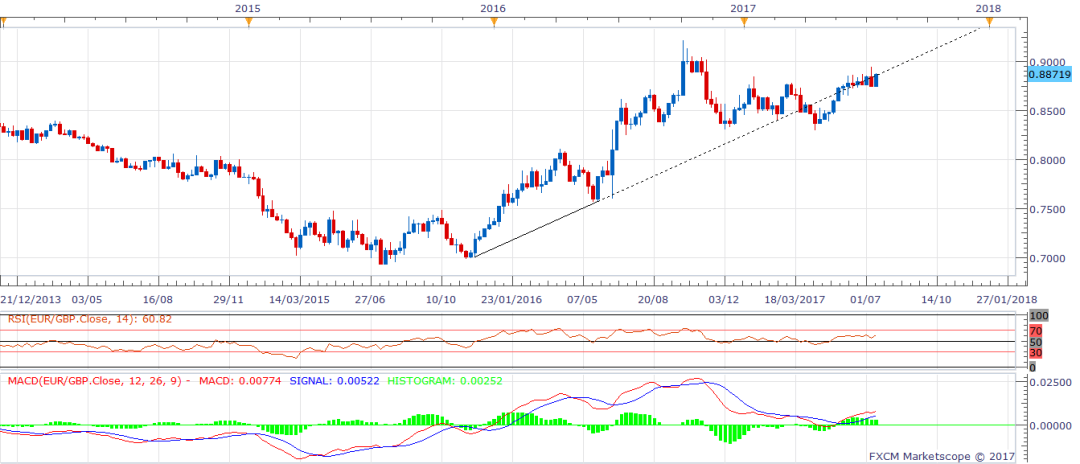
The key level to watch out for on the higher side is 0.9070 – 161.8% Fibonacci extension of the rally from 1999 low. The level acted as a good resistance in 2010, 2011, and 2016. The spike above 0.9070 last year was short lived.
The MACD shows the bullish move is again gathering pace… the RSI is rising as well

