
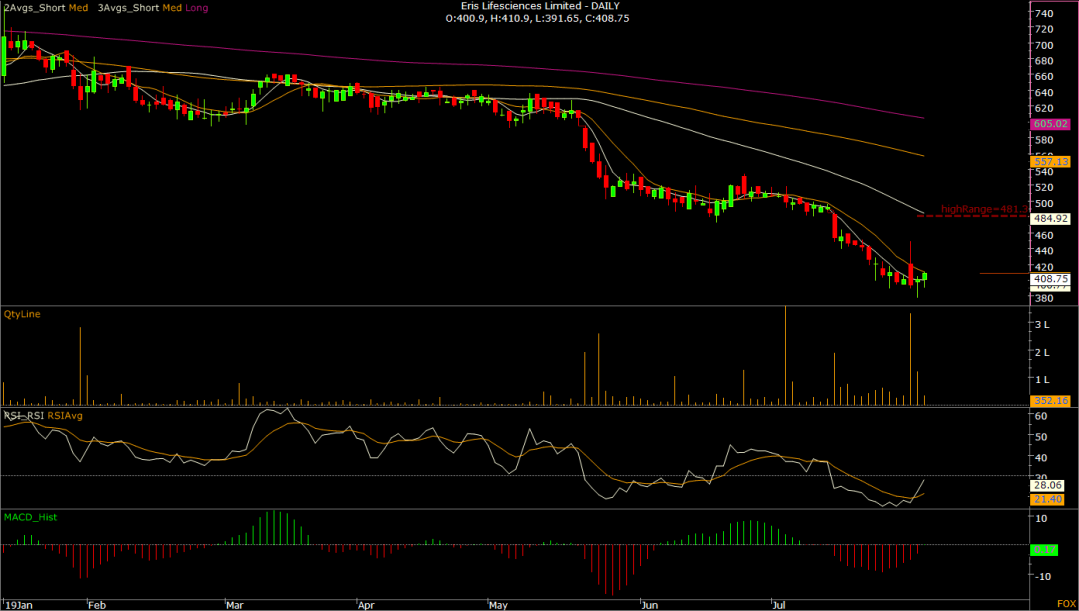
Eris Lifesciences up 1.9%, teasing bull reversal
The stock price is up 1.9% today, marking a bull follow-through to yesterday’s long-tailed doji candle.
RSI has crossed above the average and the MACD is about to rise above zero.
Looks like the tide is turning in favor of the bulls for the short-term.
Infosys drops confirming bearish divergence of RSI
Signs of buyer exhaustion near 800 not being followed by a pullback to 780. The drop confirms the bearish divergence (lower highs) on the 14-day RSI.
So, a bigger drop to 760-750 looks likely in the short run. Good to sell rallies with stops above 800

Bought Yes Bank Shares
Bought Yes Bank @87.90 for target of 106.00 with stops below 87.00.
The logic is the same as discussed on Monday.
Previous week’s candle was bullish inside reversal. Oversold as per daily RSI.
L&T Technology Services: Seller exhaustion near key support, corrective bounce ahead
This one is a perfect candidate to play a broader market bounce…
Daily chart shows back-to-back doji candles near key support of 1404.90 (Feb. 19 low). Doji is considered a sign of indecision, but when it appears after a prolonged sell-off, it mainly represents seller or bearish exhaustion.
Also note the bull divergence developing on the 14-day RSI.
Hence, m expecting a bounce to 1500.

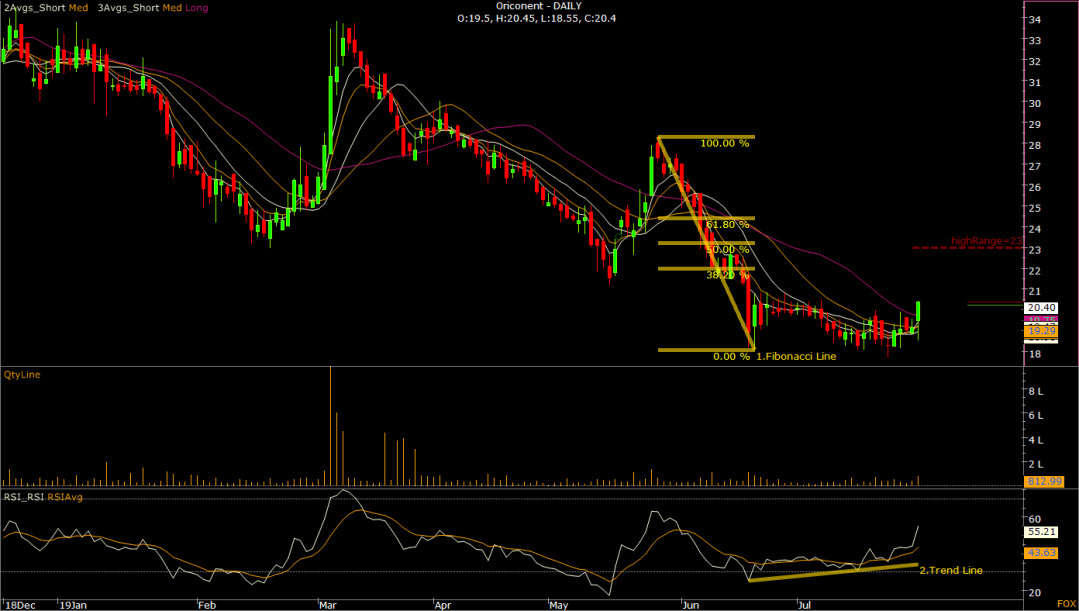
Oriconent looks good to buy
Oriconent is looking north with a bullish divergence of the RSI following a prolonged sell-off.
Daily candle is looking like a bull hammer. I see this one going to 23 this week. As of now, it is trading at 20.20.
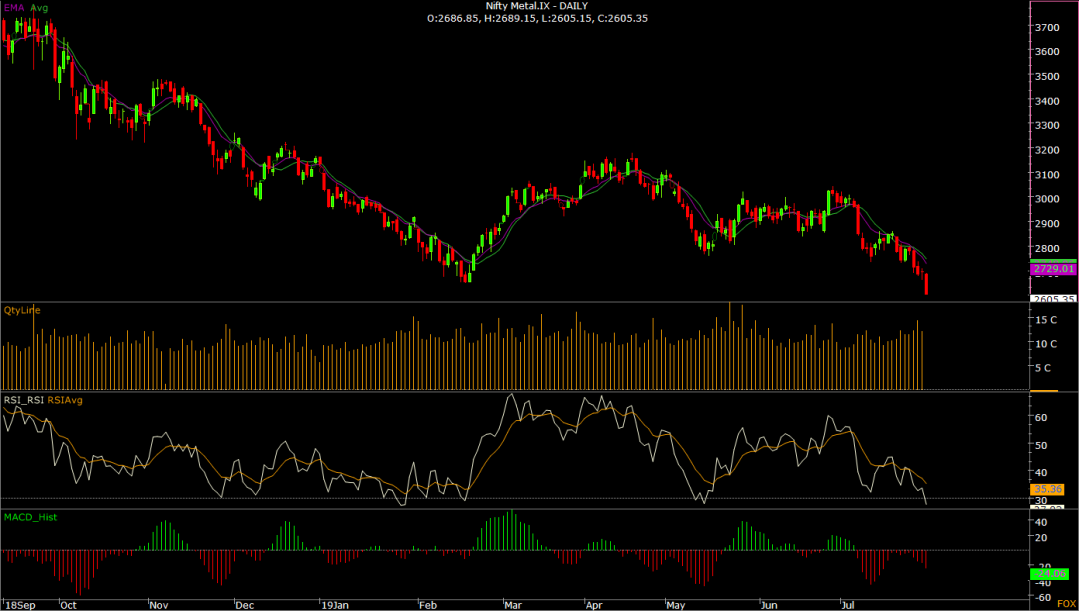
Nifty Metal index hits 2.5-year low
Nifty metals index is currently seen at 2609, the lowest level since Jan 2017. Looks set to close below 2649 (February low). That would only bolster the already bearish setup.
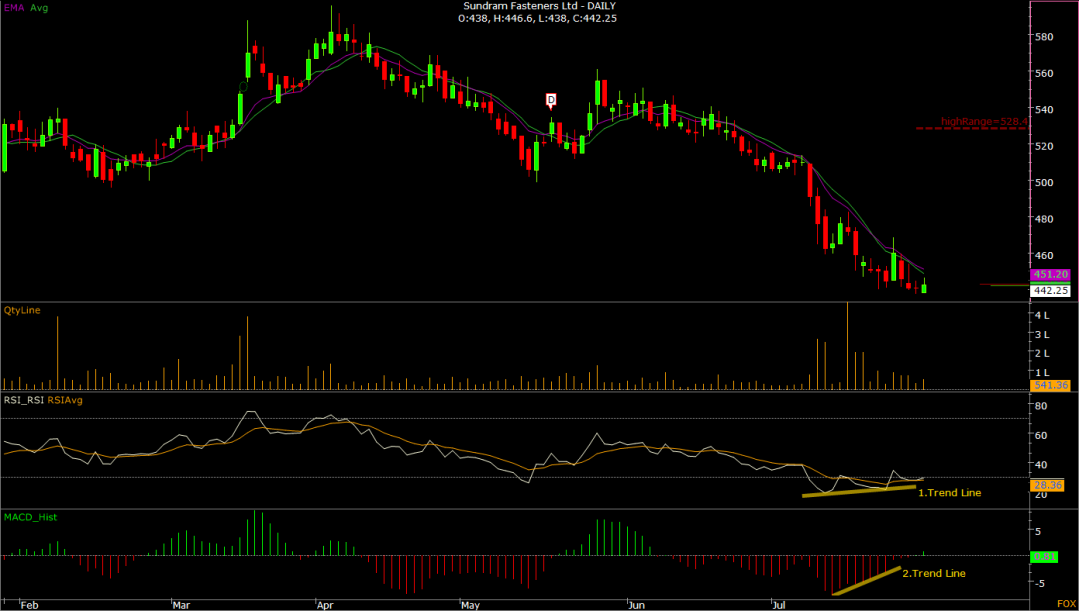
Sundaram Fasteners: Bull RSI divergence
Sundaram Fasteners’ daily chart shows a bullish divergence of RSI.
The MACD has also crossed bullish. Also, signs of seller exhaustion with doji candle on Friday.
A stronger corrective bounce to 460 looks overdue. At press time, shares are trading at 442.
Daily chart
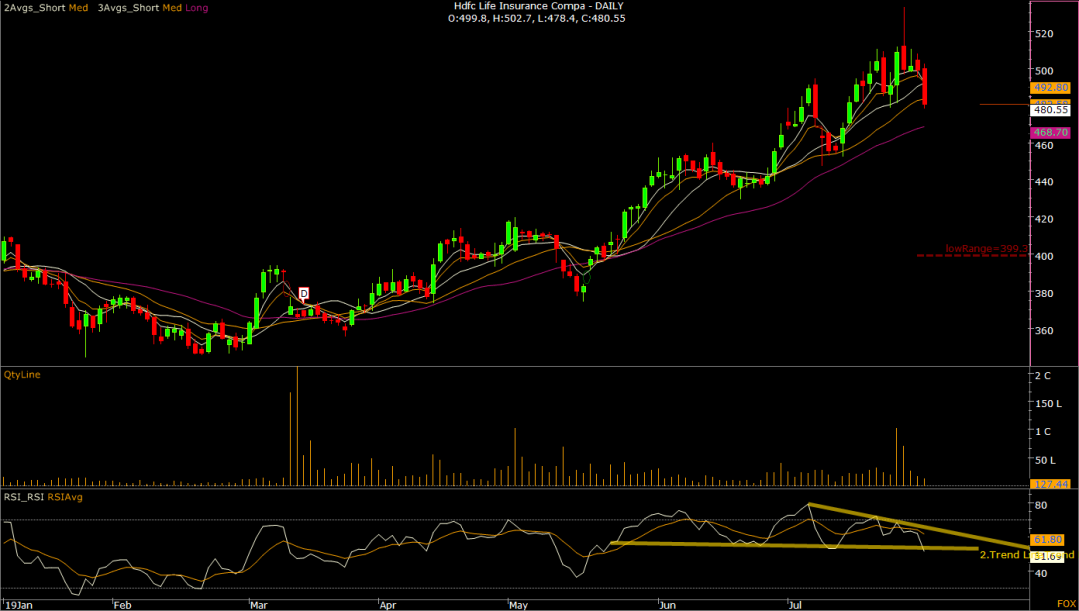
HDFC Life Insurance drops 4%
HDF life insurance is being offered with prices currently down nearly 4%. Daily chart shows bearish RSI divergence. A closer look also shows the RSI has charted a head-and-shoulders pattern.
More importantly, it has been a high-volume bearish reversal.
All-in-all, it looks like a sell on rise setup. I can see this falling to 460 in few days. As of now, its trading at 481.
Tech Mahindra: Bull RSI divergence developing on daily
Tech Mahindra fell to 641, the lowest level since October 2018, the new multi-month low, however, has not been confirmed by the 14-day relative strength index.
The bullish divergence would be confirmed if prices close with strong gains today.

