USD/CAD Forecast: Patience is the name of the game

At the moment, “No trade” is the best trade for CAD traders. It is a game of patience for both bulls and the bears. Here is why –

Daily chart

usdcad

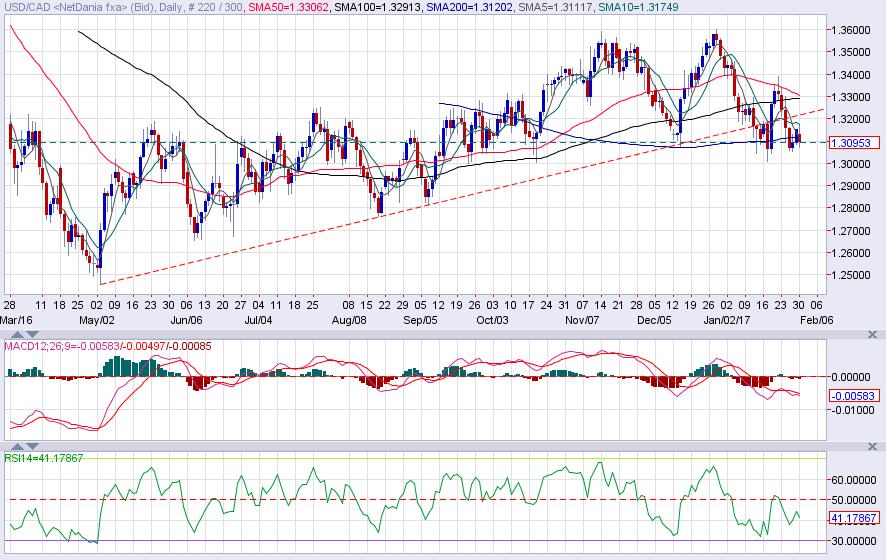
The rising trend line was breached on January 12. However, the spot found fresh bids around 200-DMA back then, owing to which it moved back above the rising trend line… only to fail at the 50-MA on January 20 and fall back to 1.3050 levels on January 26.

Since then, the bird has been restricted largely in a narrow range of 1.3060-1.3150.

One may be tempted to short USD/CAD (buy Canadian dollars) on account of the bearish daily RSI, MACD and due to the fact that the pair failed at 50-DMA and once again breached the rising trend line support.

Furthermore, we also see a falling tops formation (1.3598 – Dec high, 1.3387 – Jan 20 high).

We can also see a double top formation with a neckline support of 1.3074.

Still, the bears need to be patient as the 200-DMA has begun sloping upwards; we are yet to see a falling bottom formation i.e. the spot needs to breach the recent low of 1.3010.

Only a daily close below 1.30 would add credence to – breach of rising trend line, falling top formation, double top reversal and a potential bearish 50-DMA and 100-DMA crossover.

For the bulls to make a comeback, it is essential that the spot closes above 1.34. Moreover, one may attempt buying USD/CAD (selling CAD) on failure to hold below 200-DMA, although this is a risk trade and warrants strict/tight stops.

USD/CAD – Has the sell-off from January 2016 resumed?

The USD/CAD pair is down 0.90% or 117 pips at 1.3060 levels. The forex world was busy over the last 48 hours or so talking about what could happen to the British Pound if the UK PM Theresa May talks about ‘hard Brexit’. Well, she did and the Pound is on the tear.

In this report, we take a look at the technical set up in the USD/CAD pair. Let us begin with a look at the weekly chart –

usdcad weekly.jpg

Chart Source: www.netdania.com

The above chart shows three patterns-

  • A downside break from the Bearish flag and pole formation
  • Upward sloping head and shoulder with the neckline currently seen around 1.2857
  • A rising trend line drawn from Sep 2012 low and January 2013 low

The downside break from the bearish flag and pole formation suggests the downturn from the January 2013 high of 1.4690 has resumed. A failure to re-enter the flag on Monday added salt to the wound. Thus, the spot could slide to the head and shoulder neckline level of 1.2857 over the next couple of weeks.

What do moving averages suggest?

Weekly chart

usdcad moving avg.jpg

Chart Source: www.netdania.com

The 50-MA has topped out and is about to intersect the 100-MA from above… which would be a bearish crossover. The fact the pair is trading exactly at the point of intersection suggests the crossover could lead to further sell-off. It is observed on many occasions a crossover happens after the major part of the move has already played out.

The weekly MACD has turned bearish as well.

Call To Action – Sell on the rise for a target of 1.2857. Only a weekly close back inside the rising channel/flag would signal bearish invalidation.