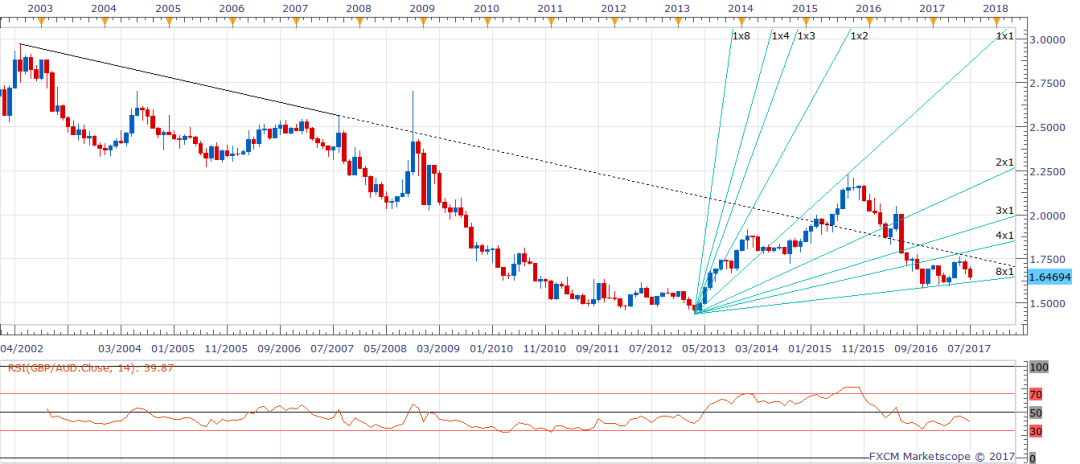
Monthly chart – Watch for a break below or rebound from 1.6190… upside to be capped around 1.75, below 1.6190 would expose 1.5789 Oct 2016 low
Monthly chart – Watch for a break below or rebound from 1.6190… upside to be capped around 1.75, below 1.6190 would expose 1.5789 Oct 2016 low
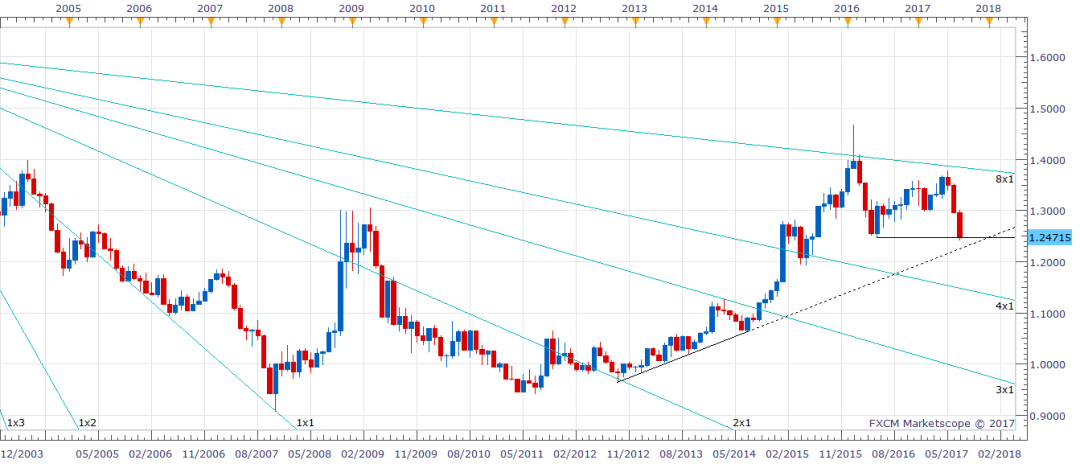
Monthly chart below shows a close below 1.2460 – May 2016 low would be followed by a decline to rising trend line supp of 1.2252.
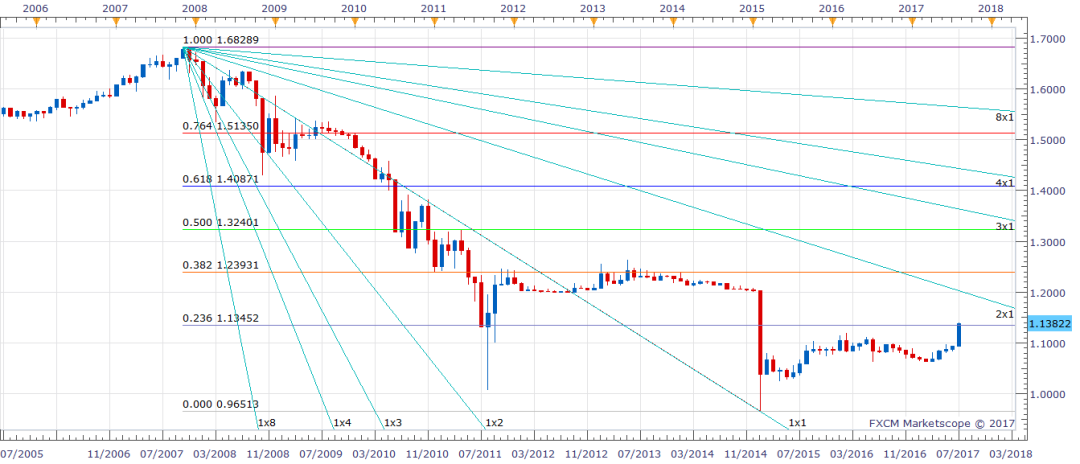
Multiple daily close above 1.1345 could be followed by a rally to 1.20 Gan fann line resistance
Daily chart
1-hour chart… nice breach of the falling trend line, we would have a sort of bullish flag breakout of the current hourly candle closes above the falling trend line. Draghi is trying hard to kill the EUR rally, but it isn’t working… everyone knows taper has already begun for countries like Germany as the ECB has fallen short of the mandatory bond purchases for three months to June.

Hourly chart

A nice falling trend line has been established following the ECB’s dovish rant. The spot looks set to test 1-hr 200-MA – 1.1461. That would push the RSI into the oversold territory, so further losses are to be viewed with caution…
ECB’s dovish bias hasn’t gone down well with the German Bund traders. The 10-year yield has re-entered falling sideways channel and is likely to extend the drop to 5-week MA of 0.48%.
Weekly chart

