Slight dovish tilt in Fed minute, June rate hike odds intact, GBP/USD looks heavy

The Fed minutes revealed nearly all policymakers favour starting balance sheet shrinking in 2017. The markets are yet again taking this story lightly. The yields should trade higher than where they are…
I see few commentators saying the Fed is not sure about the June rate hike. This is because the minutes say the policymakers feel it is better to wait for more evidence of Q1 slowdown being transitory before moving rates higher.
The comment is indeed dovish, but the markets aren’t taking this seriously either. The CME FedWatch still puts the probability of a June rate hike at 78%. Ahead of the minutes release, the probability stood slightly above 80%. So not a significant change…

GBP/USD looks heavy
Daily chartGBPUSD D1 (05-25-2017 0015).png
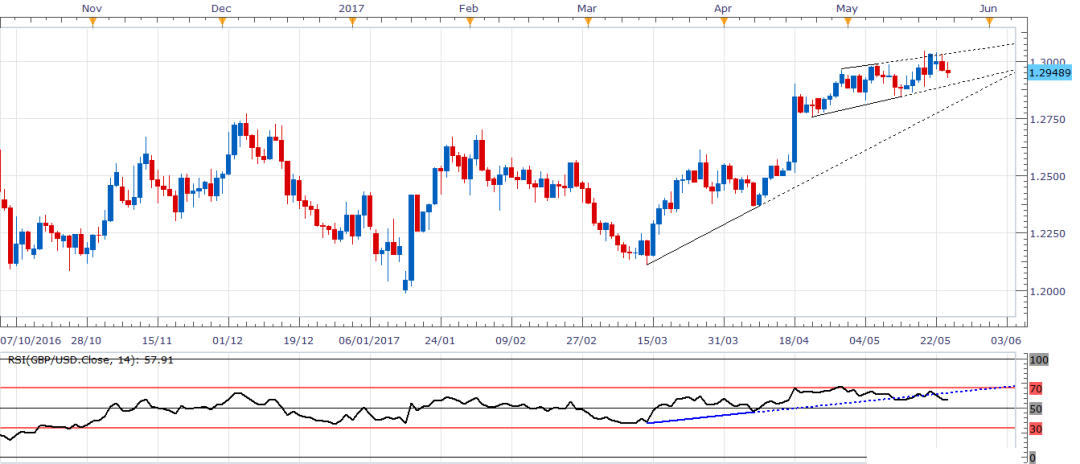
A bearish RSI divergence means the rally from the March low of 1.2109 has found a temporary top above 1.3048. The multiple failures to hold above 1.30 seen in the last few days also indicate bullish exhaustion. The RSI has moved out of the rising trend line as well.
Despite this the bears haven’t really had a big day.
A small rising channel is still intact and is seen offering support around 1.2890-1.29 levels. A break lower in favour of a bigger rising trend line support of 1.2810-1.2820 could be seen.
The pair looks heavy in the short-term, but the mid-term outlook remains bullish as long as the rising trendline remains intact.

USD/CAD eyes trendline support as BOC underplays recent inflation miss

Canadian dollar is on a tear after Bank of Canada downplayed the recent inflation miss. The bank kept the interest rate unchanged as expected and said that the inflation is broadly in line with the bank’s projections.

The bias of the statement is more towards rate hike rather than the rate cut. This should not come as a surprise as history shows the BOC rates have closely followed that of the Fed.

Technicals – Risks breaching rising trend line support

Support – 1.3380, 1.3343 – 100MA, 1.3292 – 200MA

Resistance – 1.3485 – 50MA, 1.3535 – Mar 9 high, 1.3581 – 10MA

Daily chart

USDCAD D1 (05-24-2017 1957).png

The failure to hold above 5MA and a subsequent break below 50-MA followed by a drop to 1.3447 suggests the sell-off from the recent high of 1.3639 has resumed.

The RSI is bearish below 50.00, the accumulation/distribution line also supports the case for further losses.

I expect the pair to test the rising trend line support of 1.3380. Further losses are to be taken with a pinch of salt, given the RSI would be oversold/close to being oversold by then.

Plus, the treasury yields could rise in the run up to June Fed, while a lot also depends on what happens at the OPEC meeting tomorrow.