The USD/CAD pair is down 0.90% or 117 pips at 1.3060 levels. The forex world was busy over the last 48 hours or so talking about what could happen to the British Pound if the UK PM Theresa May talks about ‘hard Brexit’. Well, she did and the Pound is on the tear.
In this report, we take a look at the technical set up in the USD/CAD pair. Let us begin with a look at the weekly chart –
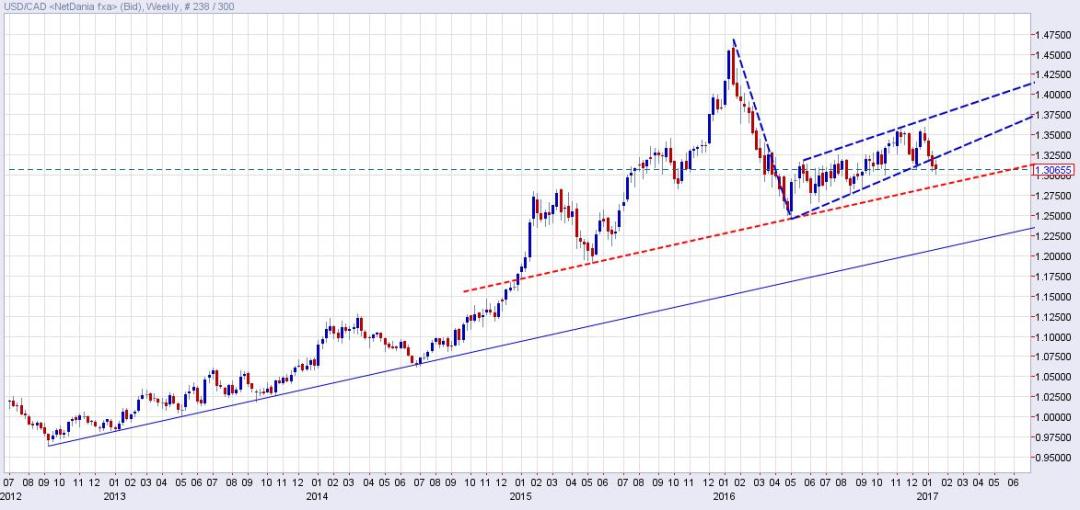
Chart Source: www.netdania.com
The above chart shows three patterns-
- A downside break from the Bearish flag and pole formation
- Upward sloping head and shoulder with the neckline currently seen around 1.2857
- A rising trend line drawn from Sep 2012 low and January 2013 low
The downside break from the bearish flag and pole formation suggests the downturn from the January 2013 high of 1.4690 has resumed. A failure to re-enter the flag on Monday added salt to the wound. Thus, the spot could slide to the head and shoulder neckline level of 1.2857 over the next couple of weeks.
What do moving averages suggest?
Weekly chart
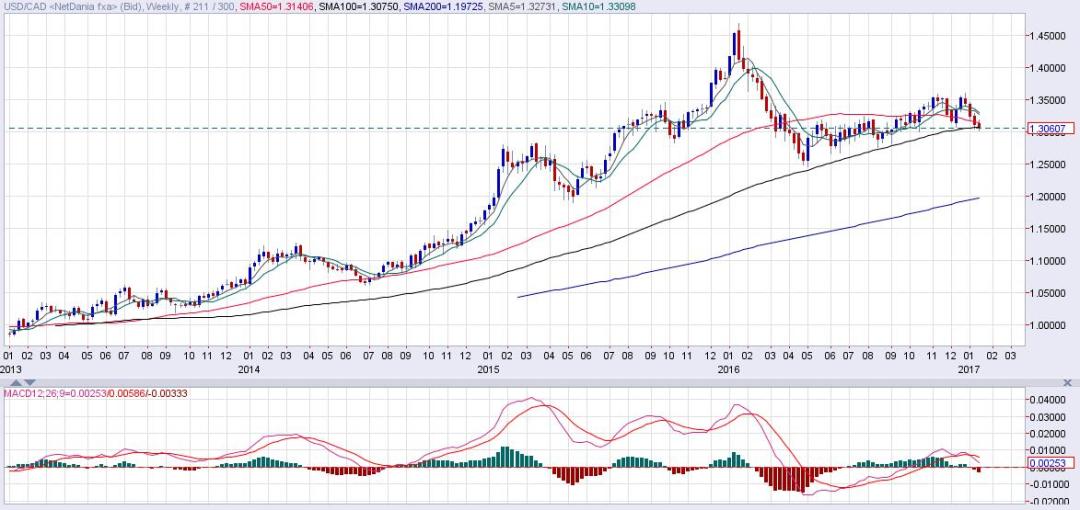
Chart Source: www.netdania.com
The 50-MA has topped out and is about to intersect the 100-MA from above… which would be a bearish crossover. The fact the pair is trading exactly at the point of intersection suggests the crossover could lead to further sell-off. It is observed on many occasions a crossover happens after the major part of the move has already played out.
The weekly MACD has turned bearish as well.
Call To Action – Sell on the rise for a target of 1.2857. Only a weekly close back inside the rising channel/flag would signal bearish invalidation.
