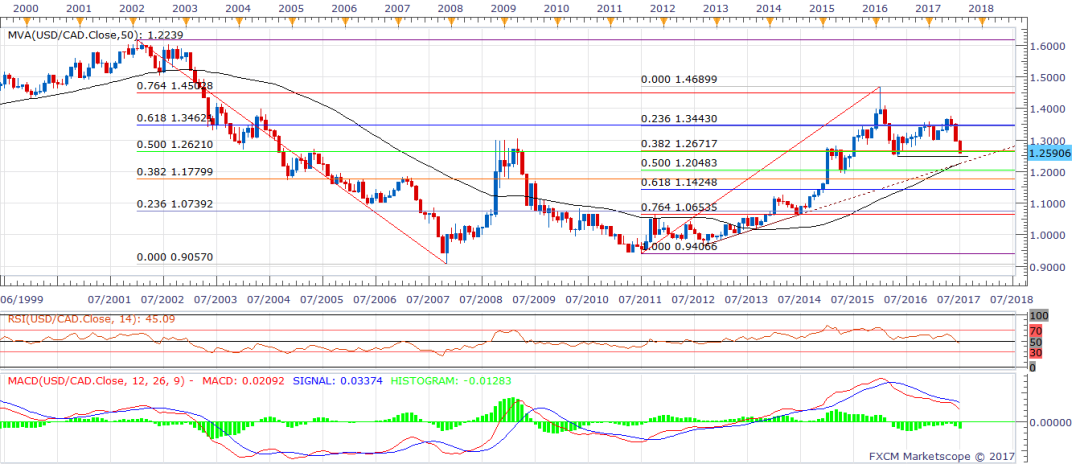
Monthly chart – Spot currently trades at 1.2590
1.2461 – May 2016 low
1.2239 – confluence of rising trend line and upward sloping monthly 50-MA
1.2621 – 50% Fibonacci retracement of 1.6185-0.9057
1.2672 – 38.2% Fibonacci retracement of 0.9407-1.4690
Indicators – RSI has turned bearish, MACD shows the bearish momentum is gathering pace
Monthly chart