Case for hike in 2016 has strengthened, want more evidence. Voted 7-3 for unch. George, Mester and Rosengren dissent
Three members have dissented First time since 2014, Rosengren switched sides from dovish to hawkish dissenter
Case for hike in 2016 has strengthened, want more evidence. Voted 7-3 for unch. George, Mester and Rosengren dissent
Three members have dissented First time since 2014, Rosengren switched sides from dovish to hawkish dissenter
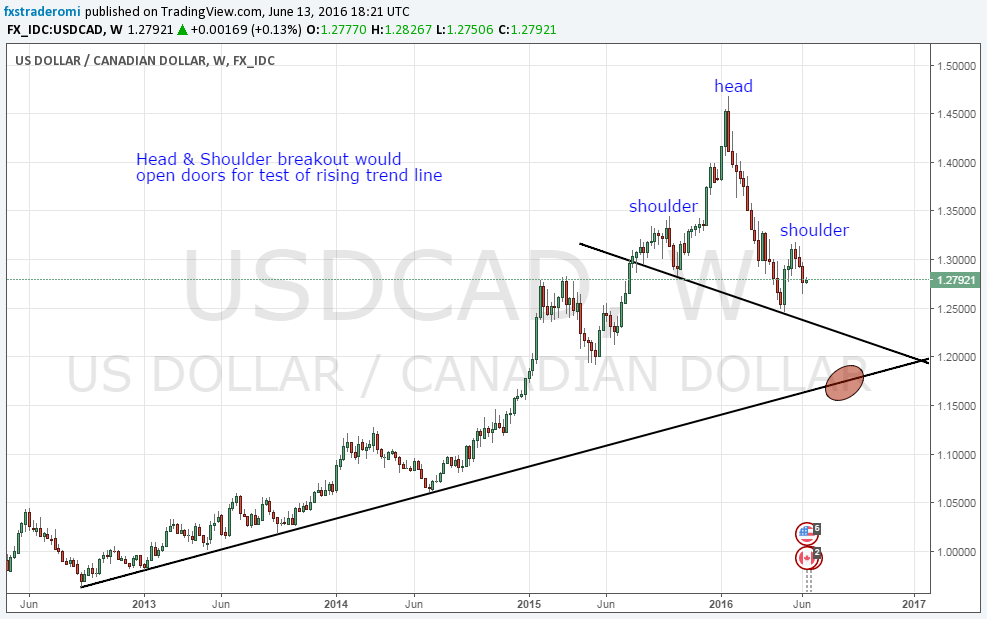
The chart looks scary for CAD bears. For me this chart indicates either oil rally is going to continue with prices moving well above $60/barrel or dollar is going to witness a broad based meltdown.
CAD bears should pray for Fed rate hike.

Shorting opportunity on cards after head and shoulder breakout. Expect at least 300 point drop from here in run up to next week’s Brexit referendum.
In this video I present my technical outlook for Brent along with a simple common sense fundamental reasoning for staying long at least in the short-run.
I have detailed technical levels for short entry as well as potential upside targets in case oil continues to rally.
First of all, let us note the producers’ meeting over the weekend is unlikely to change excess supply situation and here is why –
Hence, if we have output freeze agreement over the weekend, oil would see a gap up opening and the strength could last till Europe or early US, before “sell the fact” trade takes over – prices begin to fall.
Let us take note of the technical patterns in oil benchmarks.
Brent – Rising Channel on daily chart

WTI – Double Top on daily chart

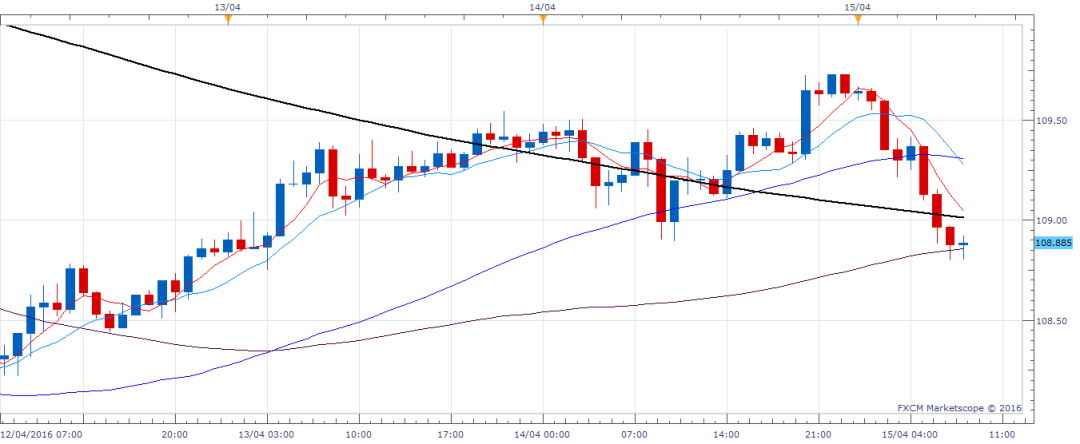
USD/JPY is finding support at hourly 100-MA at 108.86 levels.
Point to be noted – Yen is no longer following equity markets, but leading equities. The only way Yen could weaken is on the rise in treasury yields. Otherwise, there is a very little reason for an uptick in USD/JPY pair.
On technical terms, the outlook stays bearish as long as bears are able to defend sideways channel hurdle seen on the daily chart around 110.20.
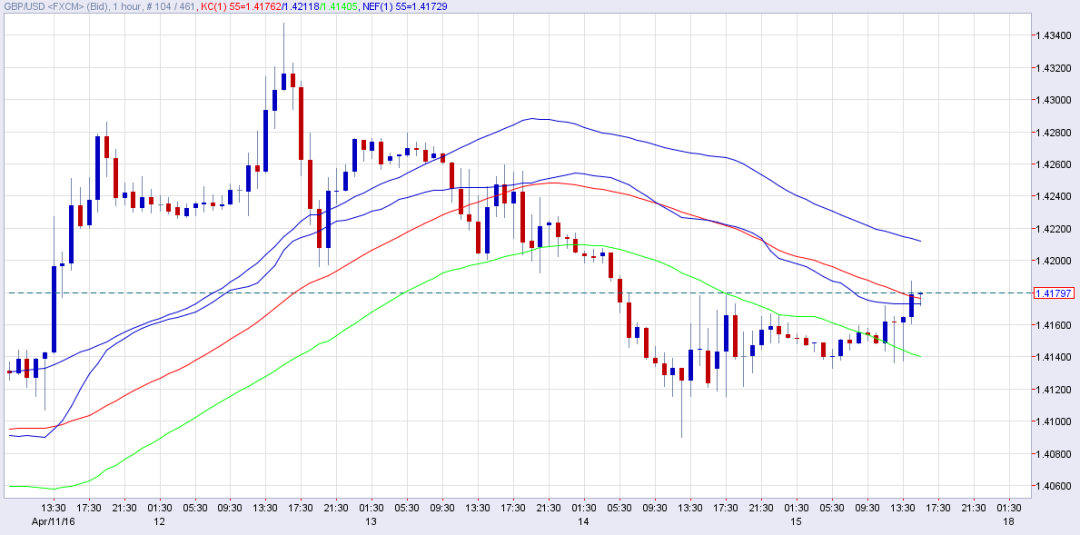
repeated rebound from 1.4136 followed by a hourly closing above 1.4166 (hourly 200-MA) has opened doors for 1.42-1.4210 lvls.
Intraday bullish invalidation is seen happening only below 1.4136 lvls.
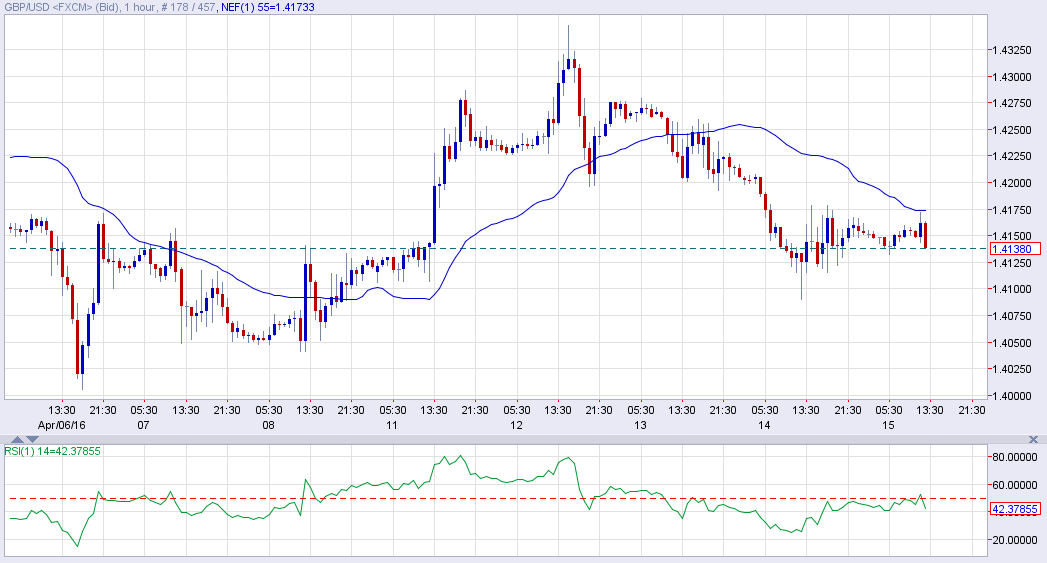
repeated failure to take out hourly 200-MA, also marking a failure to take out Ehlers filter coupled with bearish move in hourly RSI indicates the pair is heading to 1.4090 (previous day’s low_.
stops could be placed above hourly 200-MA on hourly closing basis.

Dow’s convincing break abv Apr 1 high of 17,811 yesterday has undoubtedly opened doors for a cut through 18K lvls and rise towards July 2015 high of 18,130 lvls.
However, daily RSI still remains below its previous reached earlier this month, which indicates short-term loss of momentum if not bearish takeover.
This means a drop to 17,800 lvls and violation that shall end up sending index lower to 17,500 lvls.
